


Six Sigma - Tools
Creating a SIPOC Chart

April 3, 2025


 Creating a SIPOC Chart
The SIPOC Chart, being one of the fundamental documents of any process improvement project must be developed in such a manner that it is easy to understand. It must also be coherent with the logic inbuilt in the process. There is a method which has been described to ensure the proper development of the SIPOC…
Challenges Faced in Conducting Voice of Customer Exercise
The Voice of Customer may sound like a simple exercise. However it would be safe to say that reading at the literature makes it look deceptively simple. Anyone who has an experience with market research will understand the issues involved. For a Six Sigma project to be successful, the Voice Of Customer must be accurate.…
Check Sheet – A Basic Six Sigma Tool
A check sheet is a simple tool that was once a part of the seven basic tools of six sigma. It is said that check sheet has become obsolete because of the introduction of software which have the capability to record high volumes of data and present them in a format as required. The check…
Given the usefulness of the fishbone diagram, it is essential that every student of quality and six sigma know how to use it. To aid the students in learning, here is a step-by-step procedure of how a fishbone diagram must be drawn:
Step 1 - List The Effect (Problem) to the Right: A fishbone diagram can be used for exploration only once the effect (problem) is known to the participants. The very first step in the procedure is to write the effect and a draw an arrow from the left pointing towards the problem on the right.
Step 2 - Branch Out into Categories: From the central line drawn, several categories usually branch out. These categories can be custom defined. The definition of the categories is the primary structure in the brainstorming exercise. Choosing the wrong categories can have large scale implications.
However, in most cases pre-defined categories are used. Some of the most commonly used categories are as follows:
The 8 M’s in Manufacturing: (Famously Used By Toyota)
The 8 P’s in Service Industry:
The 5 P’s in Service Industry:
Specific Causes as Branches: Once these categories have been created, it is time to brainstorm. One of the most common methods is to select a category and go to every person one by one for suggestions. Every person can make only one suggestion in one round. If they do not have a suggestion they say pass. This must be continued till most people in the group are saying pass. Once all the possible causes have been listed out as sub-branches in the category, move on to the next category. Repeat till the diagram is full.
Refine and Highlight: Once the diagram is full and the brainstorming exercise is complete, it is now time to refine the number of causes. This is because, it is likely that the brainstorming exercise has come up with 50 to 100 causes which obviously cannot be focussed upon. Therefore causes are sometimes reduced to their root cause or are prioritized. This ensures that there is consensus upon what is more important in the process.
Repeat after a Few Days: A fishbone diagram if used once will not yield great results. It has to become a regular feature of the shop-floor like it has been in Toyota for all these years. Participating members are advised to “sleep over the issues” i.e. to mull over the issues and let the group know if they have developed some sort of insight. Repeated use and undiluted focus produce great results.
Ishikawa Diagram/Fish Bone Diagram Template
Fishbobne Cause and Effect Diagram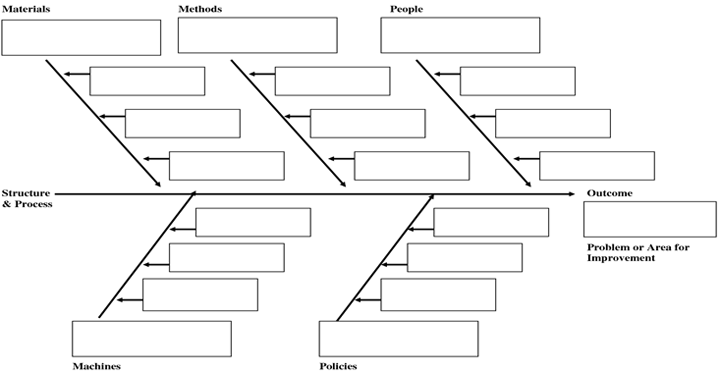

Your email address will not be published. Required fields are marked *